Diabetes is an illness that causes the accumulation of glucose in the blood due to a disability of the pancreas to produce insulin. The causes of diabetes are not yet clear, nevertheless there are certain pre-diabetic conditions that predispose a person to this illness. Among these conditions we can find the resistance to insulin (RI) and the metabolic syndrome (MS). Since these are pre-diabetic conditions, one can search for them and thus prevent the development of the illness.
The early diagnose of diabetes is highly important, it can save the patient many medical complications and enormous costs in health services.
In order to better understand this work it is convenient to define what is the MS and the RI. The MS was first described in 1988 by Reaven as a way to identify people who had high risk of suffering from cardiovascular disease; there are many criteria to identify people with MS, the most common use indicators such as the abdominal circumference, blood pressure and triglycerides and glucose levels, having standardized values for men and women. The RI is a condition caused by overweight and obesity; it appears when the cells lose their ability to respond to insulin, causing the pancreas to produce excessive amounts of insulin; in order to diagnose the RI one uses the Glucose Tolerance Oral Test (GTOT) which consists in the ingestion of 75gr of pure glucose and the performance of equally time divided blood tests.
The experimental procedure of the clinical protocol followed in this work had four steps:
- Acquisition of the ECG signal before the GTOT
- Blood sample in basal state with the patient in fast
- Ingestion of the 75gr of liquid insulin
- 15 minute ECG signal and blood sample acquisition every 30 minutes
And for the clinical protocol was necessary the measurement of: blood profile 20, lipid profile, anthropometric variables, GTOT and ECG.
This work resulted in the creation of an ECG registry database of people with metabolic syndrome that can later be used to find deeper relations between the Cardiac Frequency Variability in the different stages of the GTOT in order to find significant differences between people suffering from MS and the control group.
All subjects picked for this study were men between 20 and 44 years old, non-smokers, under no medical treatment, with no physical impairment and no evident cardiovascular disease. In addition, all patients had to provide the following data:
- Signed informed consent: were all the test conditions are informed Identification data: name, age, phone, etc (not provided in this database).
- Diagnostic data: height, weight, abdomen circumference and blood pressure and laboratory analysis. This is used to discriminate between the control and the MS group. The criteria used to determine which patients suffered from MS was the NCE ATP III and the one used to determine the insulin sensibility was the HOPAIS.
The subjects' data is detailed in the following table:
.JPG)
The data provided in this database corresponds to the ECG registries of the test subjects. Data may be found for both the controland the MS group in .csv format. For each subject 5 downloadable links will be found, one corresponding to each ECG collected during the protocol. In each file 3 registries will be found:
- number.csv: containing the ECG registry, sampled with a 16-bit resolution and 1000 Hz sampling frequency. All 12 derivations are provided in each file, each column corresponds to one derivation.
- number_QRS.csv: containing the time (in ms) when the R peaks happen in the ECG registry.
- number_RR.csv: containing the R-R intervals (in ms) for the whole registry.
readMS
This MATLAB function is used to read the ECG registries provided in this database. The function definition is as follows:
[der t] = readMS(filename, deriv)
Where filename is a string containing the name of the file to be read and deriv is a string containing the name of the derivation to be read, deriv accepts the following options: DI, DII, DIII, aVL, aVF, aVR, V1, V2, V3, V4, V5, V6 and all. The function returns t a time axis used to plot the variables and der the derivation chosen or all the derivations if deriv = all.
Additional to the variables mentioned before, the function returns a plot containing the desired derivation or three figures containing the plots of all 12 derivations. An example of the return plot if deriv = V4 is:
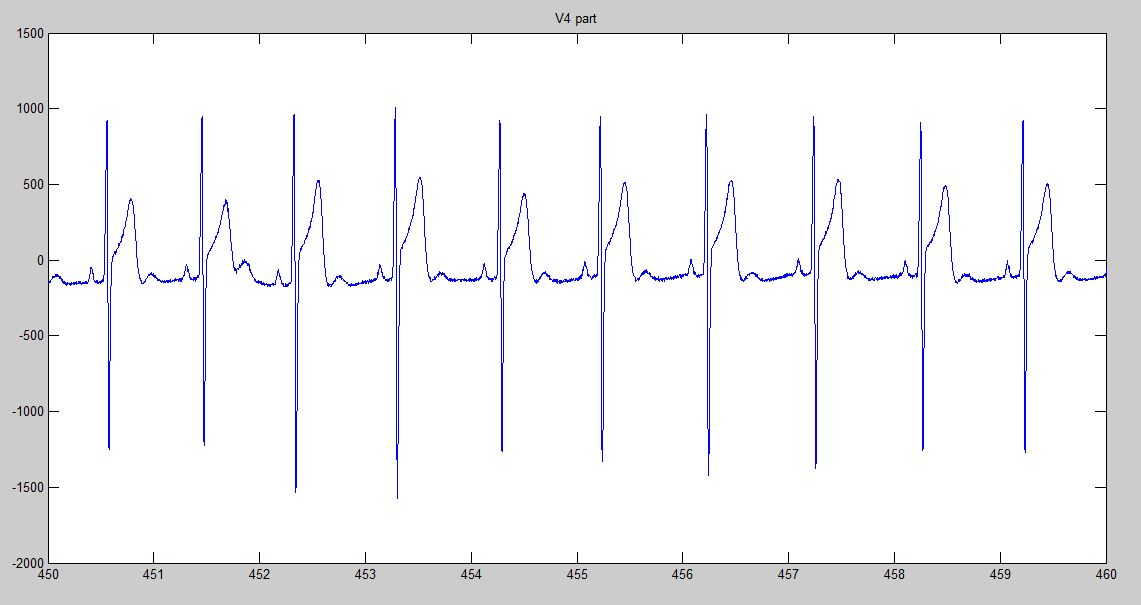
These plots may be used to check that the information being read is correct.
Make sure you have read the prior sections before using these signals. Their correct usage and results interpretation may depend on it.
To download the Metabolic Syndrome Study Database signals
click here.