ecgML
This is a method to describe a document by inserting tags in it specificaly designed for ECG data collection and analisis. The specifications are coded in XML language.
The ecgML structure allows to represent the data from the ECG following a hierarchical structure, taking into account the events, patient's data, diagnostic and other clinical data.
There are two main components for each file: i) The demographic data, containing information such as age, gender, etc; ii) the ECG registries with notations.
All the XML files downloaded from this database may be opened by using ecgML and following these simple instructions:
- Download the ecgMLbrowser application by clicking here
- Open the ecgMLbrowser and press the button file->open
- Select the registry you wish to open
.JPG)
- On the left side of the window you will find the structure panel, containing the clinical and demographical information, the clinical protocol and the notations on each P, QRS and T waves. On the right side you will find the waveform panel, showing 10 seconds of signal.
.JPG)
- If you wish to see the annotations on each heartbeat you must search on the structure panel the "wavenotations" . When double-clicking, the annotations will appear on the waveform panel.
ReadECG
This MATLAB function reads an ECG record from the DICARDIA database:
[signal t] = ReadECG(filename)
It opens the desired file and stores the 8 leads from the ECG in the independent variable 'signal'. The function also returns a time vector that may be used to plot the signals.
The input 'filename' is a sring containing the full path to the ECG record that will be read. The output 'signal' is an array of doubles containing 8 rows that correspond to the ECG derivations contained in the file. The rows contain the DI, DII, V1, V2, V3, V4, V5 and V6 derivations respectively. These signals have a 500Hz sampling frequency. The output 't' is a time axis that is coherent with the signals. It may be used to plot the signals having a time reference.
Registry reading
This MATLAB function is used to read the registries acquired using the Signal Acquisition System (SISPAS). The function definition is as follows:
[D2 v5 v6 t] = read_reg(name)
The input value of this function is a string containing the full (relative) path to the registry one wishes to read. The string must also contain the .DAT extension at the end of the file, i.e.: name = 'ControlGroup/D151.DAT'.
The return values of this function are the three complete raw signals corresponding to the three derivations plus a time axis that may be used to plot the three signals with a time reference. In addition to this, the function returns a plot showing a part of the three signals that were read. An example of the return plot of the function is:
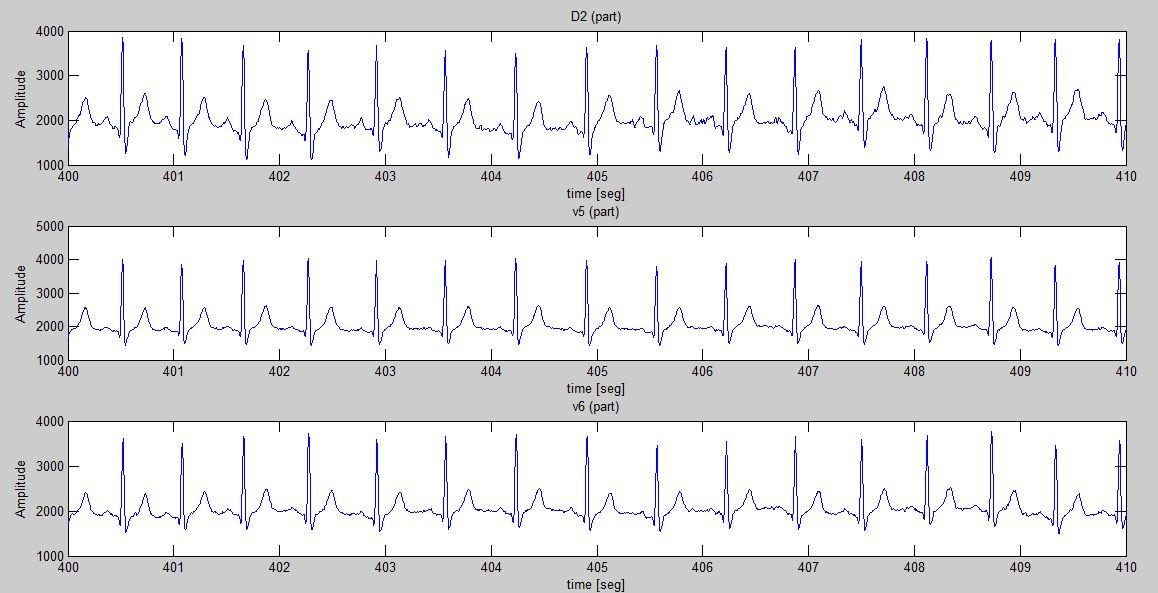
These plots are used to check that the signals were correctly read.
It's important to take into account there has been no preprocessing (other than that made by SISPAS), so the signals may need some processing before they are useful.
readMS
This MATLAB function is used to read the ECG registries provided in this database. The function definition is as follows:
[der t] = readMS(filename, deriv)
Where filename is a string containing the name of the file to be read and deriv is a string containing the name of the derivation to be read, deriv accepts the following options: DI, DII, DIII, aVL, aVF, aVR, V1, V2, V3, V4, V5, V6 and all. The function returns t a time axis used to plot the variables and der the derivation chosen or all the derivations if deriv = all.
Additional to the variables mentioned before, the function returns a plot containing the desired derivation or three figures containing the plots of all 12 derivations. An example of the return plot if deriv = V4 is:
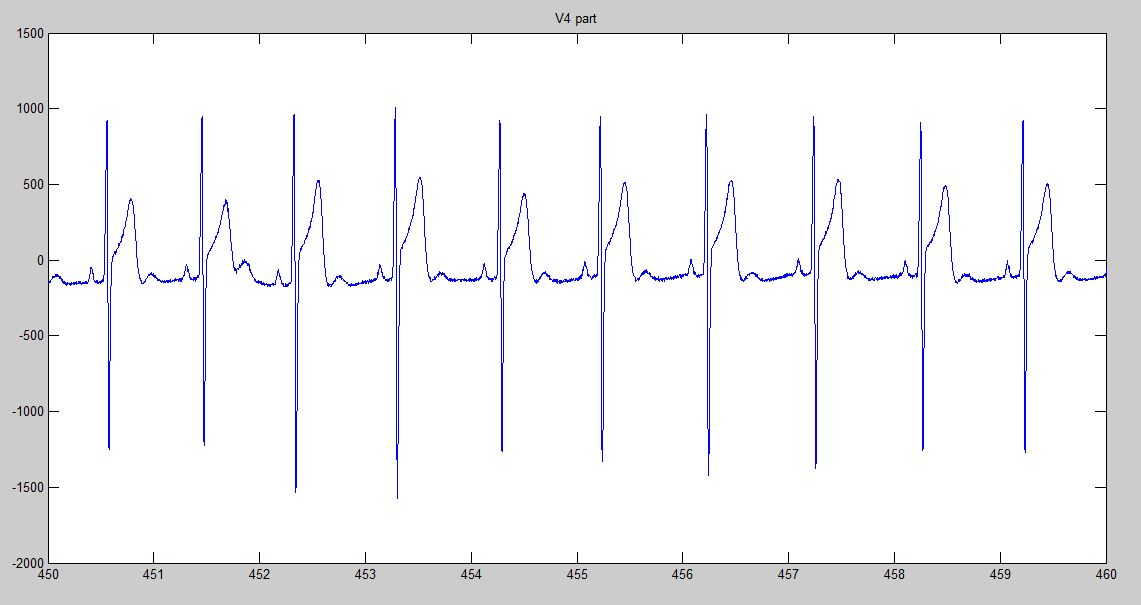
These plots may be used to check that the information being read is correct.
All purpose ECG high-pass filter
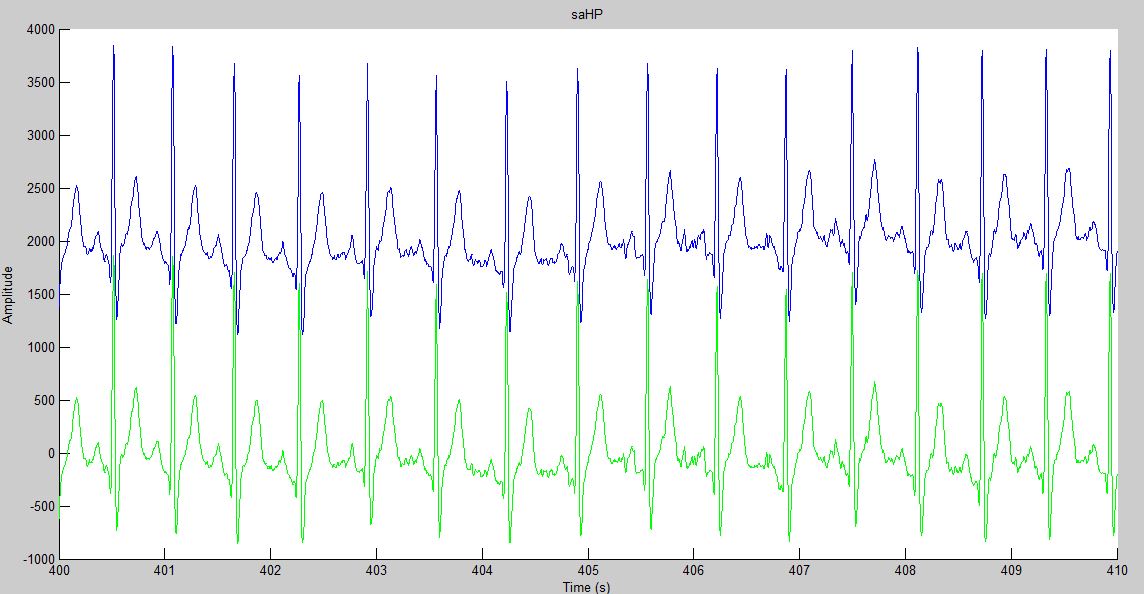
This MATLAB function removes the baseline wander from an ECG signal. To do this it applies a highpass Butterworth filter to the input signal. The function definition is as follows:
out = HPF_ECG(x1, Fs)
This routines receives two input parameters: 'x1' is an array of doubles containing the ECG signal that will be filtered and 'Fs' is a double containing the sampling frequency of the signal.
The routine returns 'out' which is an array of doubles containing the filtered ECG signal.
The following image shows the result of applying this routine to an ECG signal. The original signal is shown in blue and the filtered signal is shown in green.
All purpose ECG low-pass filter
This MATLAB function removes high frequency noise (greater than 40Hz) from an ECG signal. To do this it applies a lowpass equiripple FIR filter to the input signal. The function definition is as follows:
out = LPF_ECG(x1, Fs)
This routines receives two input parameters: 'x1' is an array of doubles containing the ECG signal that will be filtered and 'Fs' is a double containing the sampling frequency of the signal.
The routine returns 'out' which is an array of doubles containing the filtered ECG signal.
The following image shows the result of applying this routine to an ECG signal. The original signal is shown in blue and the filtered signal is shown in green.

Multi-Lead/Pan and Tompkins Detector
This function MATLAB routine detects the apperance of QRS complexes in an ECG signal. To do so it processes multiple ECG leads using a modified Pan - Tompkins algorithm and uses multi-lead analysis to eliminate false positives and false negatives.
b = detectPT(sig,der,fs)
The function receives three input parameters: sig' is an array of doubles containing all the leads that will be processed and compared, each column of the array must correspond to an ECG-lead. sig(:,1) = lead1, sig(:,2) = lead2 and so on. 'der' is an integer specifying how many leads are contained in 'sig'. 'fs' is the sampling frequency.
The function returns 'b', a vector containing the detection results. The vector contains the indexes of the samples where detections were made. Also, the function will return an image (such as the one shown below) containing a 10 second sample of the detection results.

This detector was tested on the MIT-BIH Arrhythmia Database, showing a sensitivity of 91.72%, and a positive predictive value of 99.17%. Also, it was tested on the St. Petersburg Institute of Cardiological Technics 12-lead Arrhythmia Database, showing a sensitivity of 95.54% and a positive predictive value of 99.88%.
Wavelet-based R, P ant T waves delineator
This MATLAB function detects the apperance of R, P and T waves in ECG recordings sampled at 250Hz. It also delineates the ECG, marking the beginning and ending of each individual wave. To do so, it uses wavelet analysis.
[R, QRSon, QRSend, T, Ton, Tend, P, Pon, Pend] = detectW(signal)
The function receives the input parameter 'signal', which is a column vector of doubles containing the signal that will be processed. The signal must have a sampling frequency of 250Hz.
The function returns 'R', 'P' and 'T' which are vectors containing the R, P and T wave detection results, respectively. Each vector contains the indexes of the samples where detections were made. The delineation results are stored in the variables 'QRSon', 'Ton' and 'Pon' for the waves' beginnings and 'QRSend', 'Tend' and 'Pend' for the waves endings.
Also, the function will return an image (such as the one shown below) containing a 3 second sample of the detection results.

This routine hasn't been tested on standard databases yet, but a visual inspection on numerous signals shows very good performance.